As a premium subscriber to the retirement budget calculator, you will be greeted with your Dashboard after you log in.
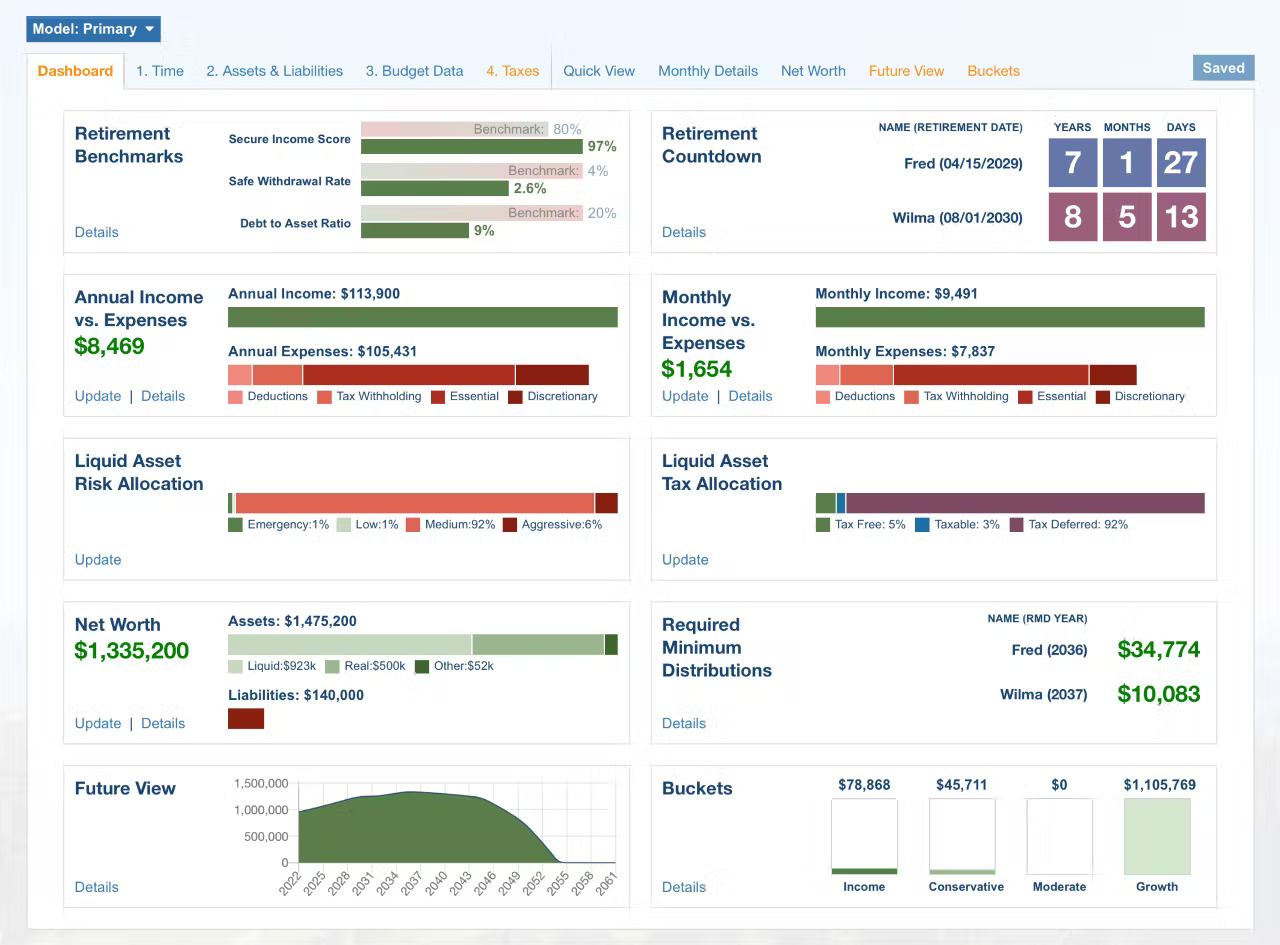
The Dashboard provides your full retirement picture at a glance.
Let’s take a look at each of the Dashboard’s elements.
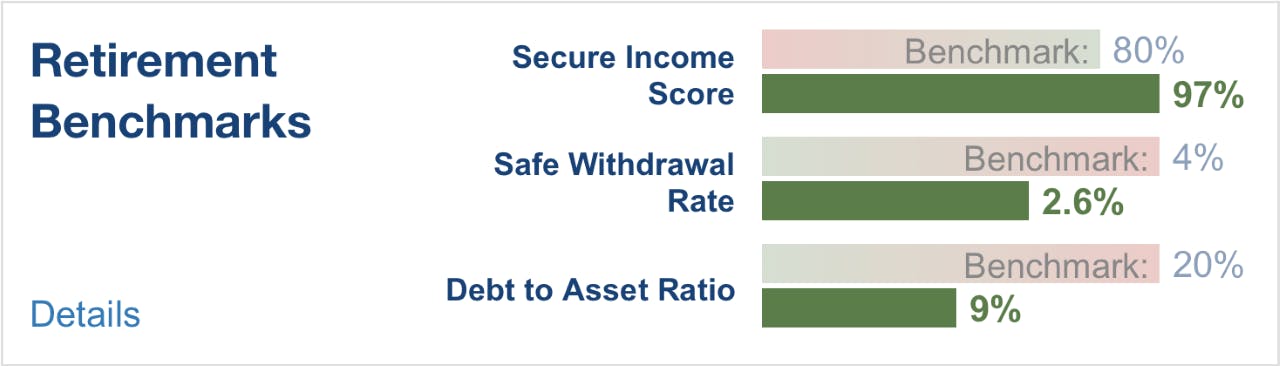
The retirement benchmarks element will help you make the critical decision when to retire. It compiles your financial data and compares it to established benchmarks, commonly found in the retirement planning industry.
The secure income score calculates the percentage of your lifetime income coming from guaranteed sources, such as social security & pensions - when compared to your lifetime essential expenses.
Ideally 80% or more of your essential expenses should be covered by guaranteed income.
The safe withdrawal rate, or commonly known as the 4% withdrawal rule, says that you can withdrawal 4% from your investment portfolio the first year of retirement, followed by cost of living adjustments every year for a 30 year time period. This formula looks at your withdrawal percentage the first full year of retirement - which is the year following the second person’s date of retirement.
Debt to Asset Ratio divides your current debt into your current assets.
The goal is to have a debt at 20% or less of your total assets before retiring.
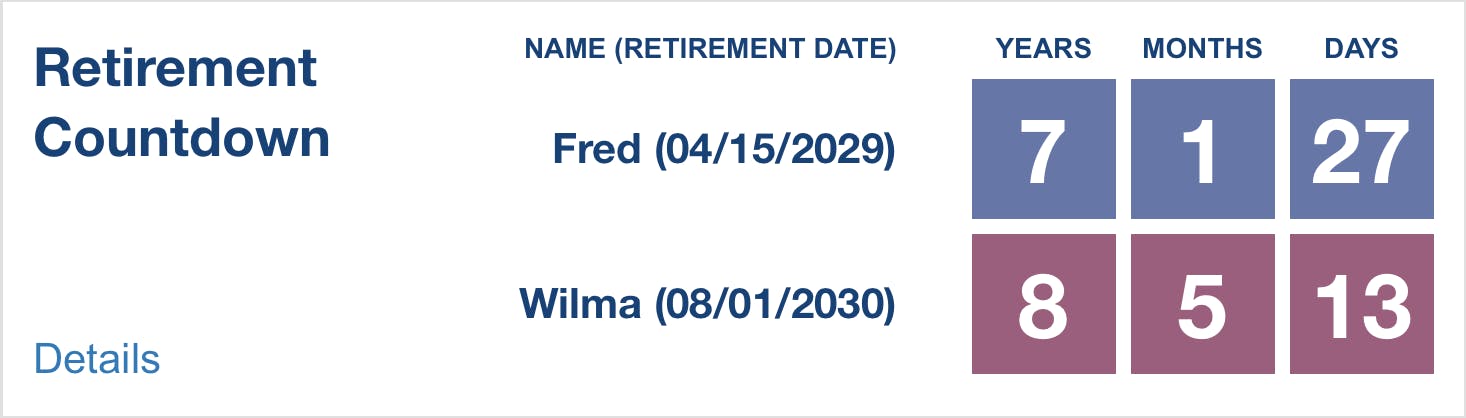
This element collects data you entered into the Time tab and displays the retirement date and a countdown until retirement.
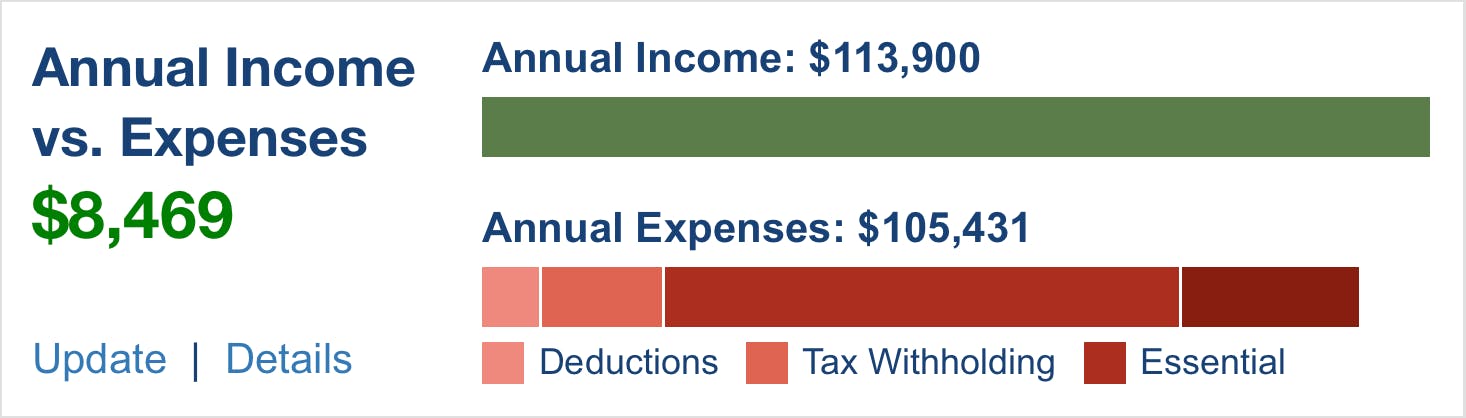
This element displays your Income vs Expenses for the current year. It collects the data you’ve entered into the Budget Data tab.
Clicking on “Update” takes you directly to the Budget Data tab where you can make changes.
Selecting “Details” will take you to the “Quick View” tab which shows an itemization of the current year’s income and expenses.
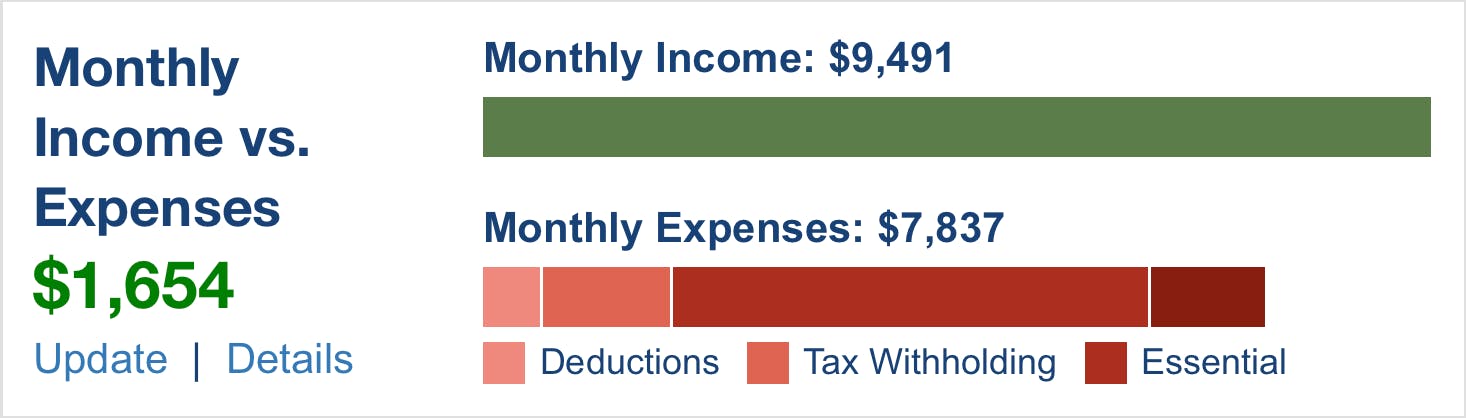
This element displays your current monthly Income vs Expenses.
Clicking on “Update” takes you directly to the Budget Data tab where you can make changes.
Selecting “Details” will take you to the “Monthly Details”.
You will notice on both the Monthly and Annual Income vs Expenses elements that the Expense graph displays various expense categories such as essential and discretionary expenses.
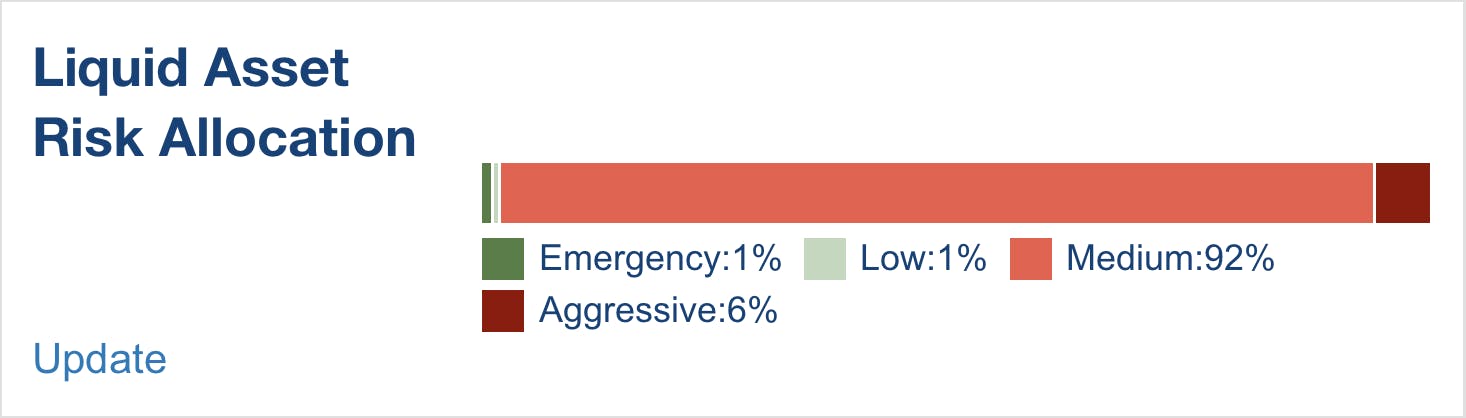
This element displays the current risk you associated with your liquid assets and the balance of those assets.
It displays this in percentages.
Clicking on “Update” takes you to the Assets & Liabilities tab from where the Dashboard collects your data and where you can make changes.
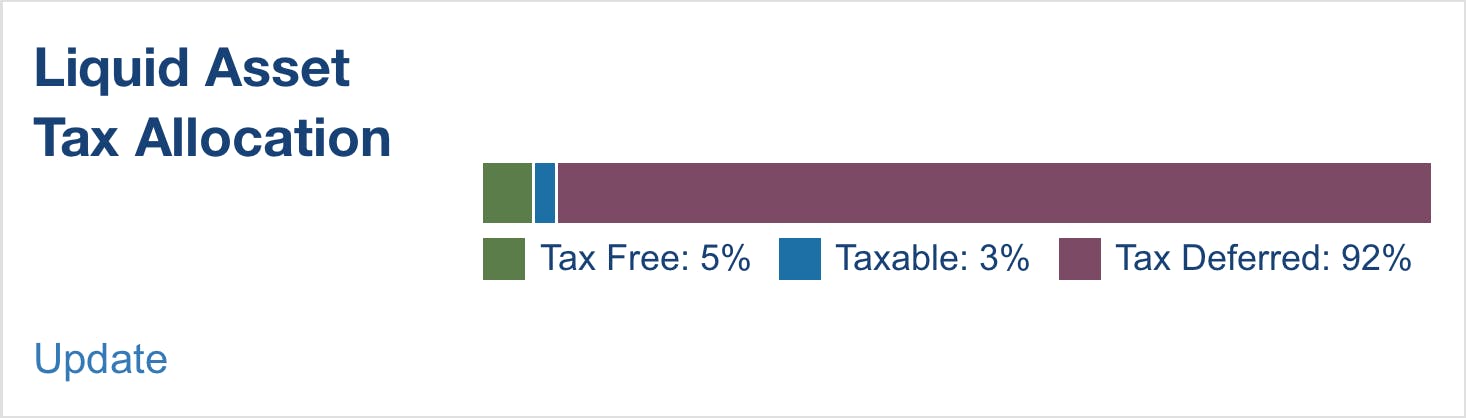
This element displays the tax treatment of your liquid assets.
Like your Liquid Asset Risk Allocation, this element draws on data in your Assets & Liabilities tab.
Specifically, how you associate the account type - such as a 401K, Roth IRA, brokerage, etc.
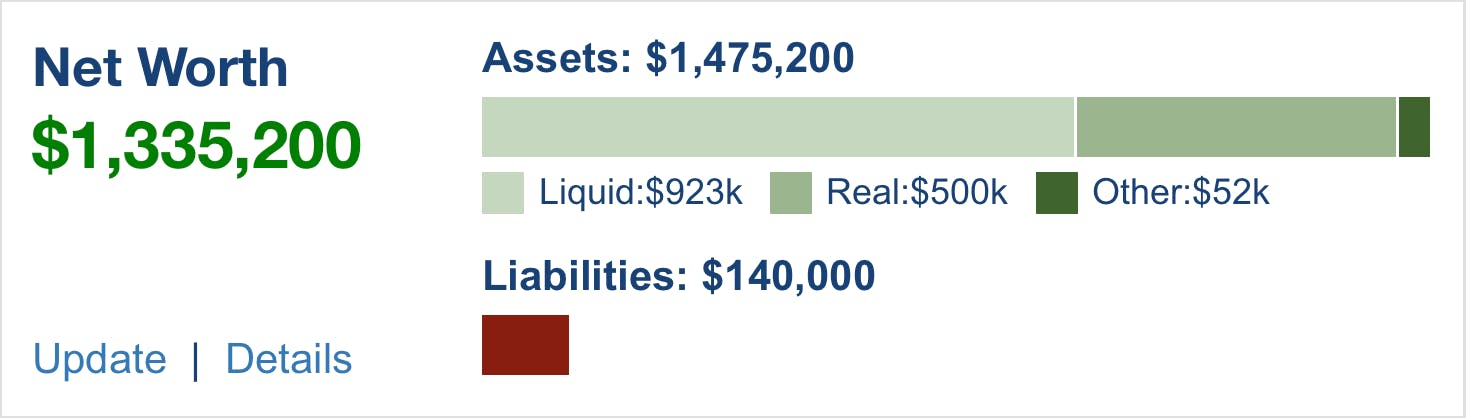
The Net Worth element collects the financial data you entered into the Assets & Liabilities tab.
It displays your assets, liabilities, and your total net worth.
Clicking on “Update” will take you to the Assets & Liabilities tab where you can make changes.
Selecting “Details” will take you to the Net Worth tab where you can view a Net Worth Report in more detail.
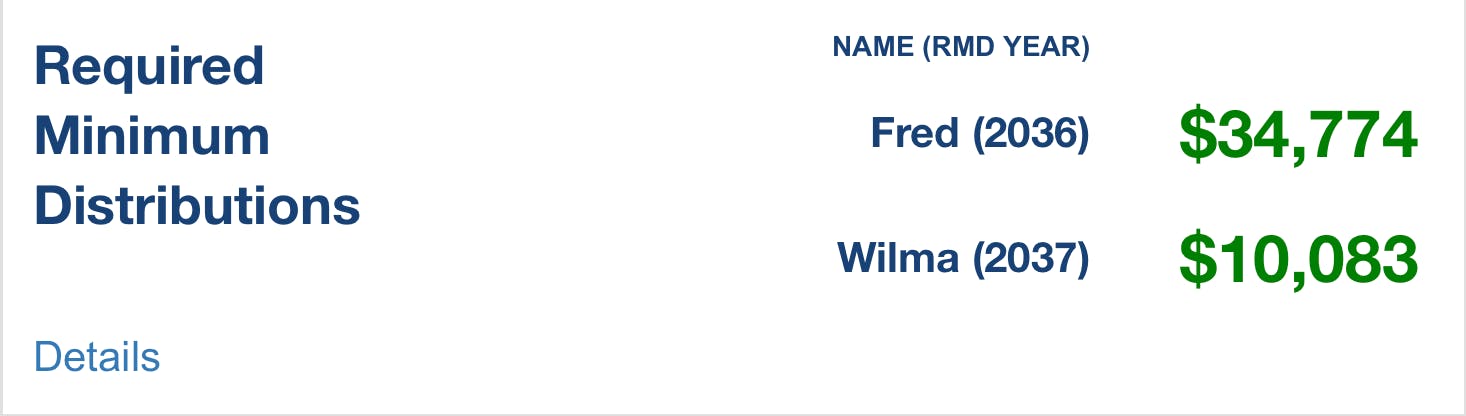
This element displays any RMD beginning at age 72.
It displays current data collected from the Future View tab and is based on the Estimated Growth Model you chose, tax treatment of those assets, and the balance of your net liquid assets at age 72.
Clicking on “Details” takes you to the Future View tab
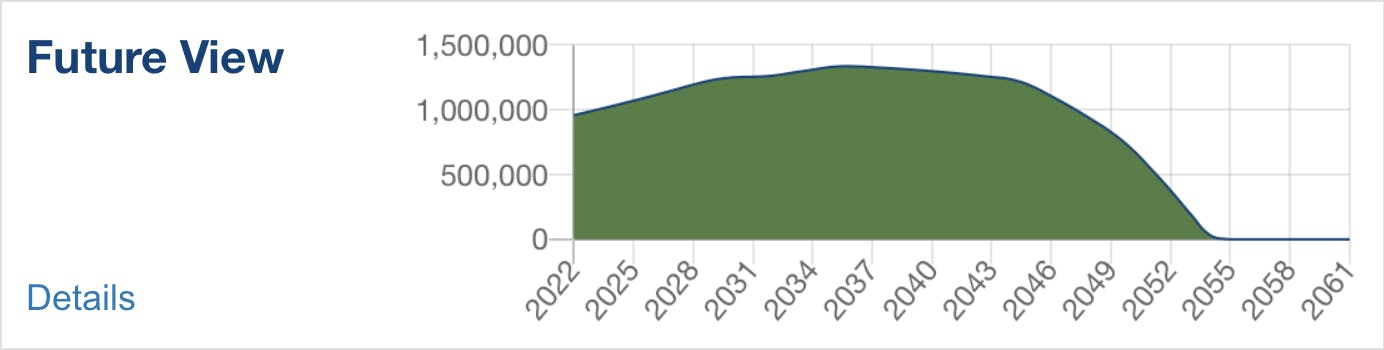
The Future View element displays the graph found in the Future View tab. It shows the balance of your net liquid assets over time.
Clicking on “Details” takes you to the Future View tab
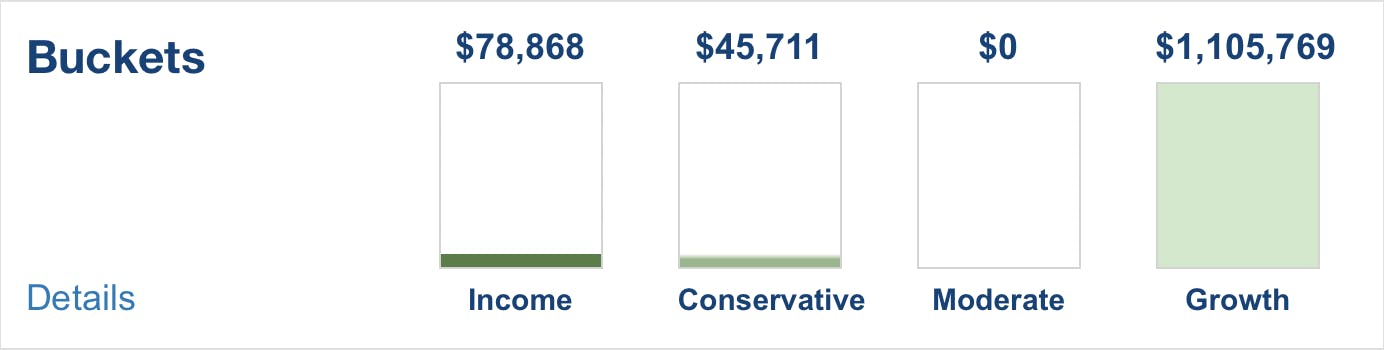
The Buckets element compiles data found in the Buckets tab, which in turn collects data from your Future View.
It represents money you will need from your liquid assets after you retire if your expenses exceed your income.
Money will be pulled from your liquid assets to cover the difference.
Each bucket is based on when you need to pull money from your liquid assets as displayed in the Future View.
Income displays money needed from your liquid assets 1 to 3 years after retirement
Conservative displays money needed 4 to 6 years after retirement
Moderate displays money needed 7 to 9 years after retirement
Growth displays money not needed 10 or more years after retirement
CONCLUSION
The RBC Dashboard helps you make decisions about your financial future.
Have I saved enough?
When is the best time to retire?
Do I need to adjust my spending?
Am I well diversified with my investments?
Will my money last?